
Sponsored by:
US cities map investors snapping up affordable homes

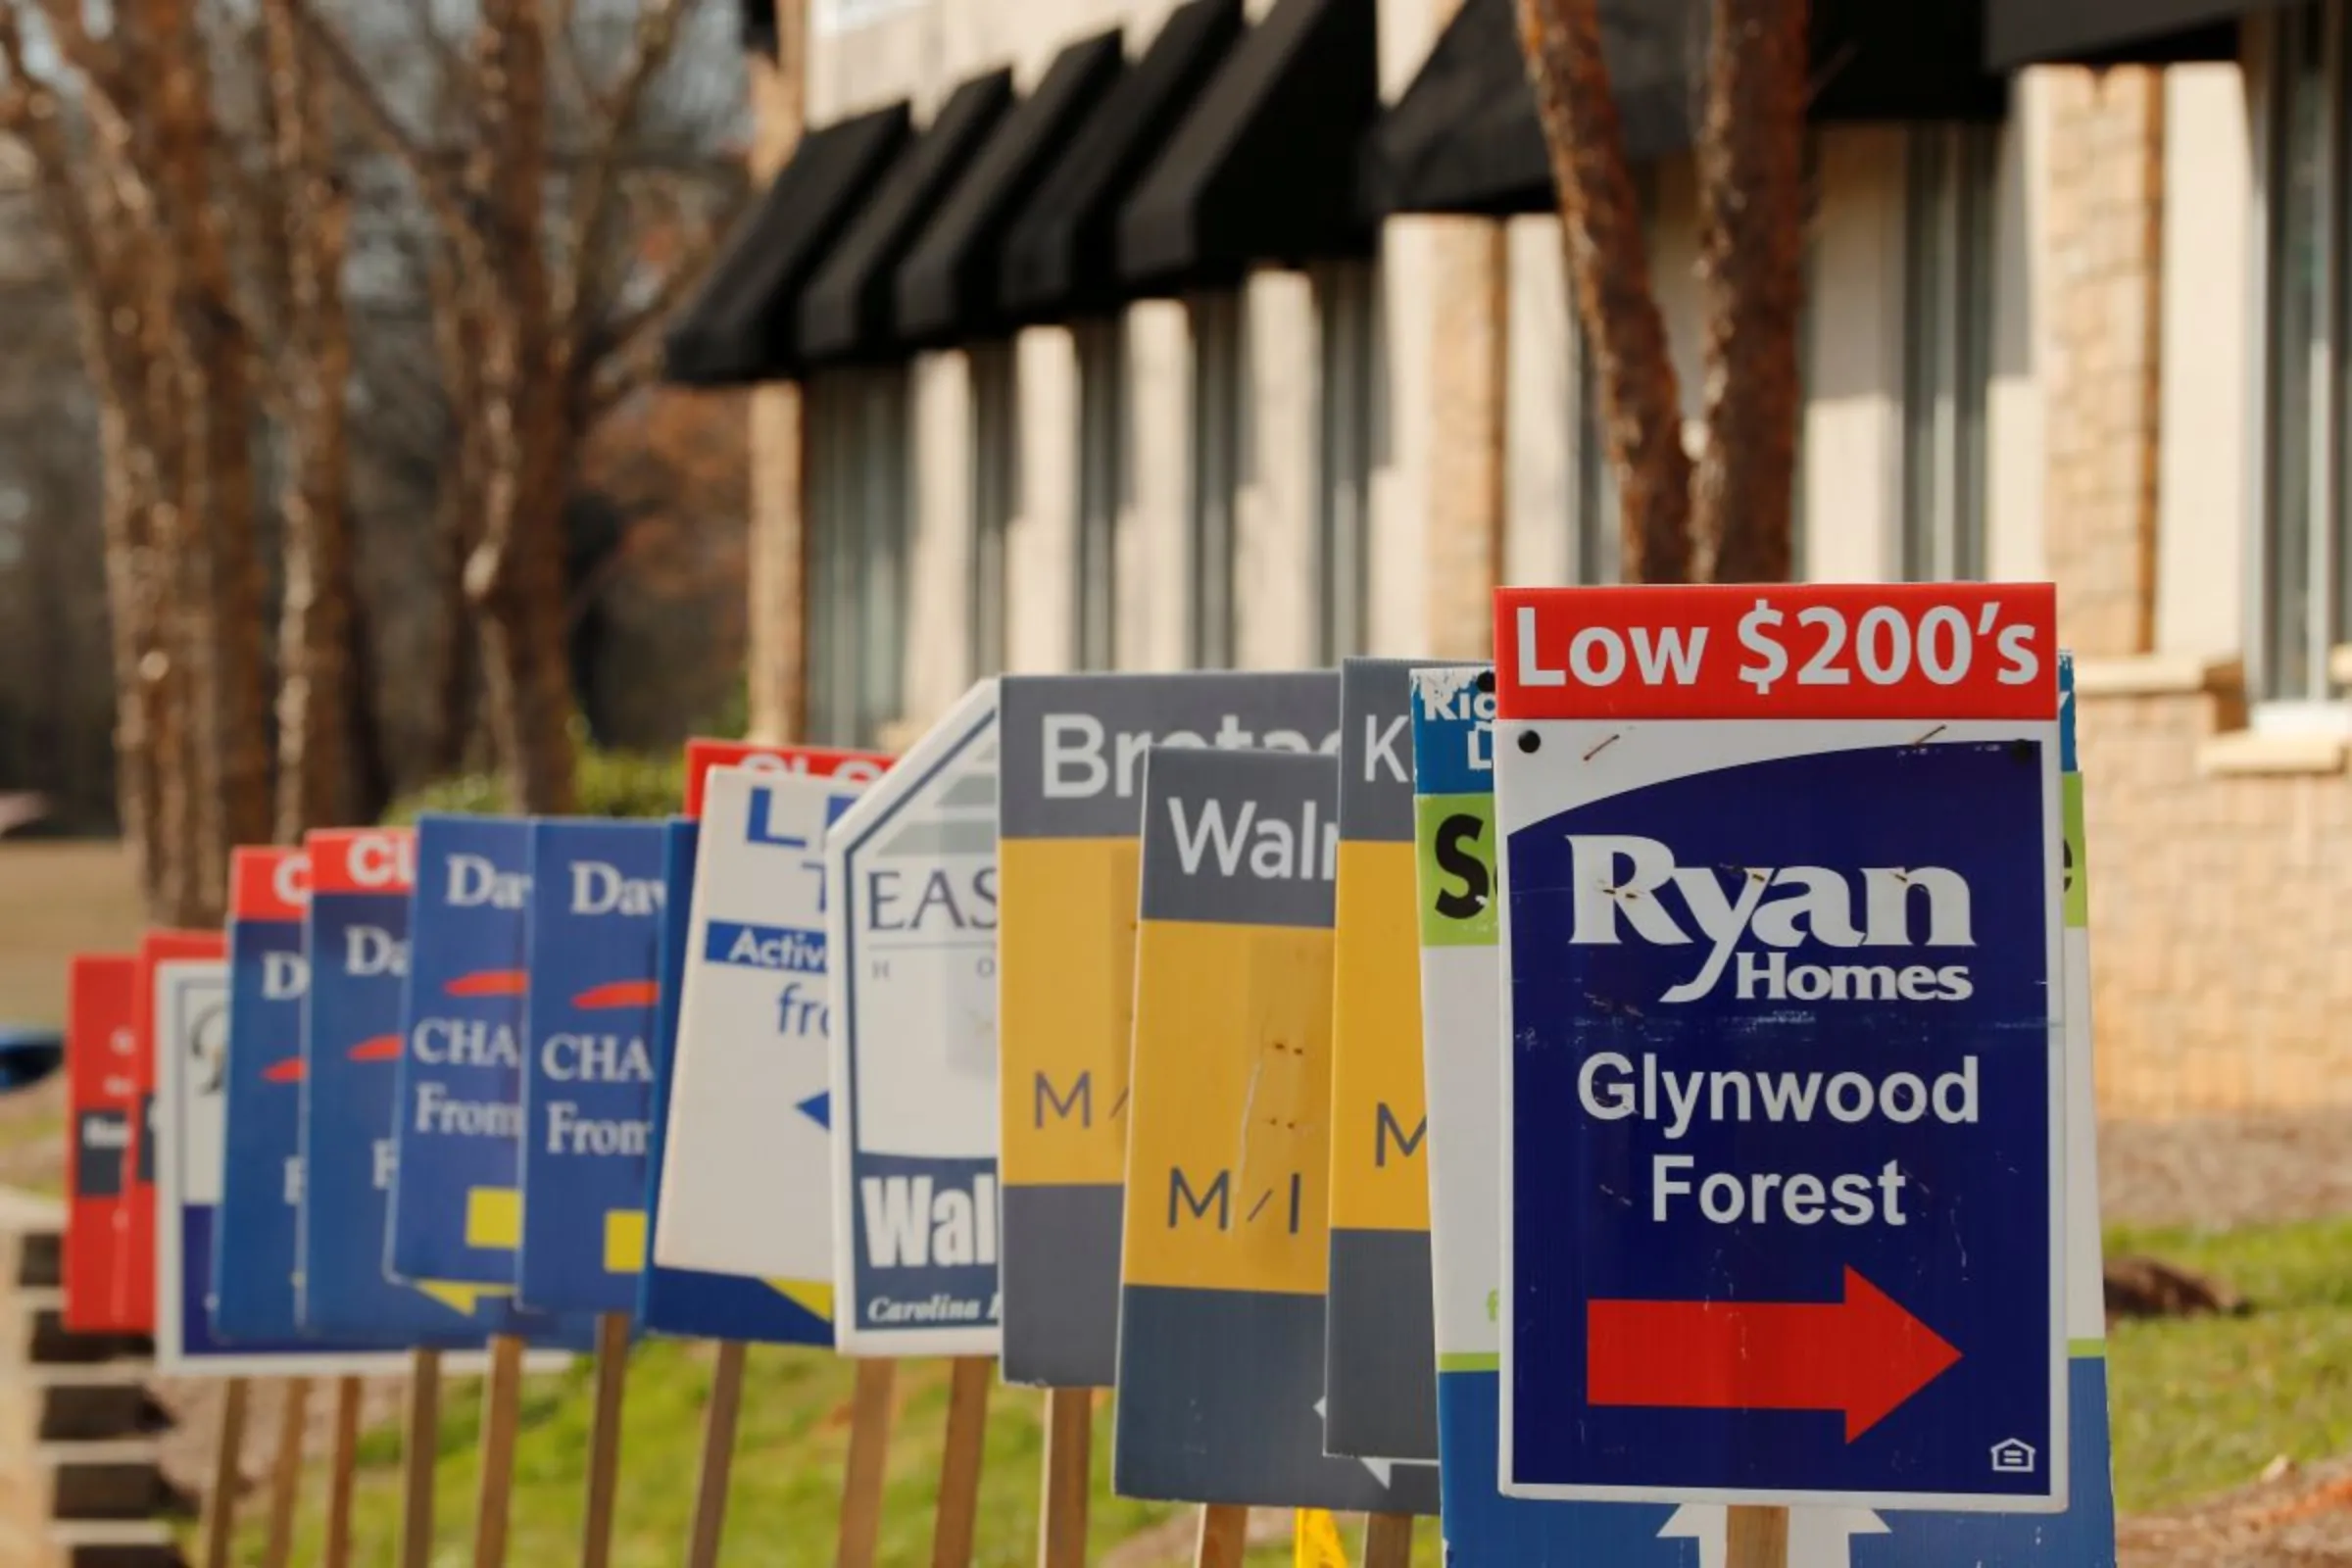
Real estate signs advertise new homes for sale in multiple new developments in York County, South Carolina, U.S., February 29, 2020. REUTERS/Lucas Jackson
What’s the context?
Projects across the country seek to provide hard data and visualise growth of home purchases by investors
- Cities lack data on corporate home purchases
- National project seeks to offer understanding of trends
- New tech, open data fuel similar local efforts
WASHINGTON - Even as corporate purchases of homes across the United States have spiralled upward, making it harder for many to afford to buy, local officials say they remain hamstrung in responding by a lack of hard data about what exactly is going on.
"We're government – we don't pay attention to private real estate transactions," Dina Blaes, regional development director for Salt Lake County in Utah, told Context.
"But we have such a horrific housing crisis, we need to understand who the players are," she said, calling institutional home purchases a "sleeper" issue "that we need to get ahead of".
Such purchases cause rents and home prices to rise, the federal government says, while residents and activists complain of poor maintenance and other issues.
So Blaes and others are turning to a suite of geospatial, data-mining and artificial-intelligence technologies to map the spread of home purchases by private equity and corporate landlords.
For Salt Lake County, that has meant working over the past year to bring together data from the county's 23 jurisdictions.
Geospatial expert Jeff Allenby is heading that mapping work, with Salt Lake County one of a few dozen local jurisdictions and even whole states that he and his team are helping to map their property ownership patterns, including Houston, Philadelphia and Massachusetts.
Local officials and others had been hearing "anecdotal stories about institutional investors coming in, but no one had a map of where it was going on or any hard statistics," said Allenby, director of the Center for Geospatial Solutions at the Lincoln Institute of Land Policy think-tank.
Cities also lack the technical expertise to crunch the numbers, said Allenby, who started the Who Owns America project two years ago to help.
"Thriving communities need to have investment by the people that live there. We're seeing institutional investors are making that opportunity for regular cities, especially in low-income areas, increasingly inaccessible," Allenby said.
"So part of this is to daylight what's actually going on ... and move it out of anecdotal discussion to say what's happening today. Is it as bad as we think?"
Growing pandemic trends
Institutional investors increasingly turned to housing following the 2008-09 mortgage crisis in the United States in an effort to diversify their holdings and risk.
Private equity and other national financial groups purchased 200,000 single-family homes from 2011 to 2017, and such activity "surged" during the COVID-19 pandemic, especially in poor neighbourhoods, according to the U.S. Department of Housing and Urban Development (HUD).
City authorities, researchers and advocates say such groups are seeking to purchase relatively cheap homes that can quickly be turned into rentals with minimal additional investment.
Industry groups say private equity investments represent less than 1% of the single-family rental market and help to improve housing and stabilise local housing markets.
Allenby looked first at publicly available data in Baltimore, coming up with a way to map property ownership types and how those changed from 2015 to 2022.
He found growth of institutional ownership was clustered, with the economic and racial makeup of an area appearing to be a significant factor, and with some trends accelerating during the COVID-19 pandemic.
In some areas, he found "an increase year-over-year in the investor-owned and business-owned properties ... with some seeing up to a 5 to 6% decrease in owner occupancy, typically in lower-income and higher-minority areas."
The analysis helped policymakers push for new policies limiting such activity, Allenby said.
More recently, Allenby's team mapped properties burned in the wildfires that destroyed swathes of the Hawaiian island of Maui last year, trying to work out which were resident homes and which were vacations rentals owned by out-of-state investors.
Similar considerations are fuelling work to map forest ownership across the state of Alabama, particularly to track the growth of foreign property ownership, said Alicia Cramer, a senior vice president with the U.S. Endowment for Forestry and Communities, a non-profit that helped fund the Who Owns America project.
Foreign investors make up the third-largest landowner in Alabama, Cramer said, making wealth concentration a key policy consideration for rural economic development – overarching details on which have not been available.
"Most of the past insights have been done on a very local level," she said. "So this helps us look across the map."
Cramer said the Endowment is now hoping to scale up the work across the country.
Power of maps
The emergence of new technologies and open-source data has also spurred a rise in local mapping efforts to address housing concerns.
Nearly a decade ago, geographer Joshua Akers undertook a year-long effort to map housing ownership consolidation in Detroit, and with colleagues created a project called Property Praxis that is still updated.
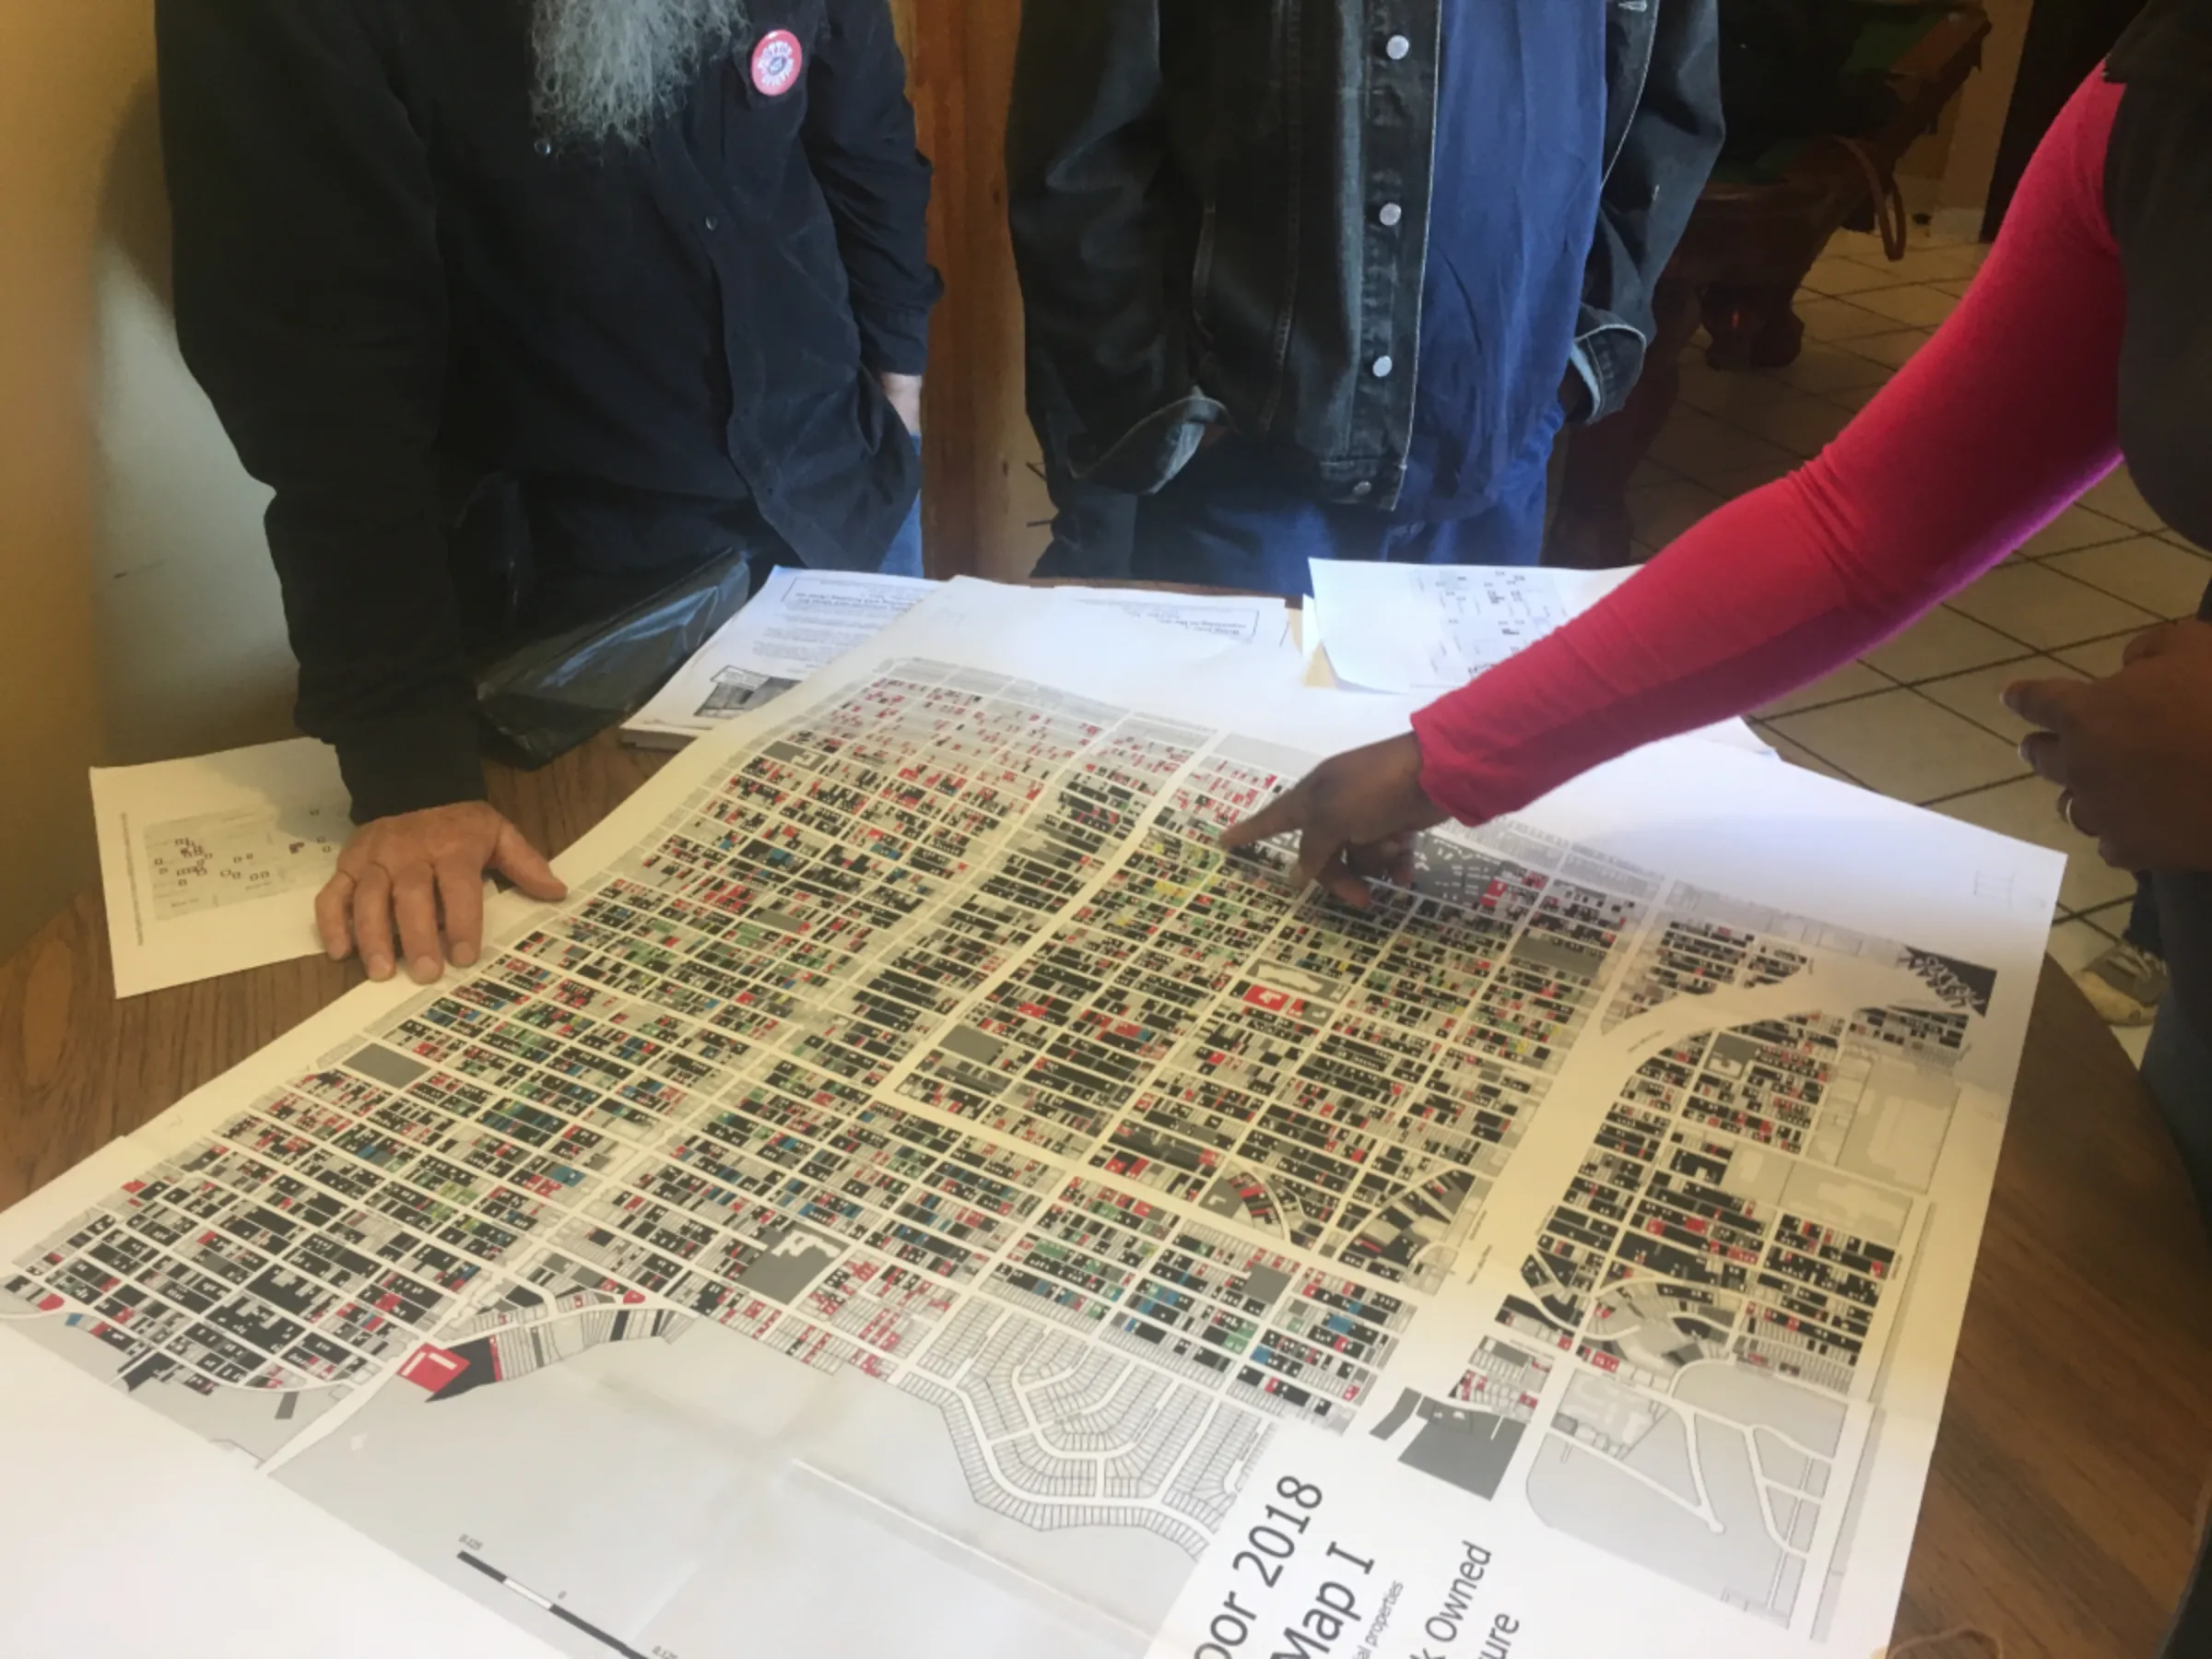
Local residents and organizers look at a property ownership map in Detroit in 2019. Property Praxis/Handout via Thomson Reuters Foundation
Local residents and organizers look at a property ownership map in Detroit in 2019. Property Praxis/Handout via Thomson Reuters Foundation
Akers, then with the University of Michigan, said the project was a response to growing concerns from local tenants and neighbourhood groups following several years of "bulk buying" of homes by institutional investors.
The city at the time was unable to offer much assistance, he said, but it had just started an open-data initiative.
Akers recalled testing the tool with community members, when one elderly woman looked at data showing how a vacant home in her neighbourhood had changed hands repeatedly, and said, "That's what's going on!"
Similar work since has taken place in San Francisco, New York, Cleveland, Atlanta and elsewhere.
The importance of that work is only rising, said Taylor Shelton, a geographer at Georgia State University, with ongoing ownership consolidation changing neighbourhood dynamics across the country.
Last year, his mapping work on Atlanta found that just 10 companies owned some 30,000 properties – as in Baltimore, often mirroring racial patterns.
Mapping offers a uniquely powerful tool not only to help residents understand broader trends and how they fit into them, but also to point to underlying causes – something municipal-led mapping often does not do, he said.
"The real power of all of those initiatives is that they are really focused not just on presenting the data, ... but on having a larger analysis of conditions that gave rise to the patterns that we see," Shelton said.
That can help "develop the broader narrative – who's to blame, what do the proposed solutions actually do, what are the gaps."
(Reporting by Carey L. Biron; Editing by Jon Hemming.
Context is powered by the Thomson Reuters Foundation Newsroom.
Our Standards: Thomson Reuters Trust Principles
Tags
- COVID-19
- Wealth inequality
- Housing
- Race and inequality
- Cost of living
- Corporate responsibility


Featured Podcast

6 EPISODES
Podcast
Go Deeper


Latest on Context


- 1
- 2
- 3
- 4
- 5
- 6